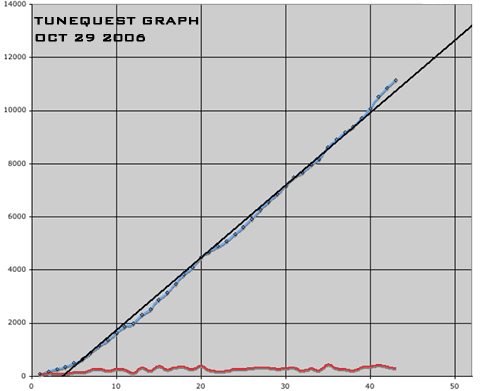
Here’s the latest data from my tunequest performance. I’m fairly confident at this point that I will beat the life-of-project trendline as shown above. The question at the point is whether I will out-perform it enough to actually meet the goal of listening to all ~14,200 songs in my iTunes library by the end of the year. For this graph, the right edge represents the last week of 2006. The blue line is total songs listened. The redline is the number of songs per week. The black line is the trendline/projection.
When isolating just the past few weeks’ worth of data, the trendline is more optimistic.
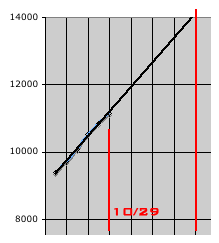
The small red line above is this past weekend and the long one is the end of the year. Using data from the past six weeks, we see a trendline that ends just before the year runs. Unfortunately, this graph tops out about 200 songs short.
Of course, these conditions hold true with the usual caveat that my library size is subject to change. But I don’t expect any major fluctuations in the next eight weeks.