A rambling, self-indulgent, inconsequential post about habits, statistics, speculations, accumulation and missing data.
::
I can’t help but be disappointed that I can’t see lifetime stats for my music listening habits. In these days of play count-tracking programs like iTunes and websites like Last.fm, it’s easy to get caught up in the musical trends of your life. It’s especially interesting when you look at the numbers and discover that you perhaps don’t like a certain style of music as much as you thought you did or you find that you listen to a particular band much more than you would have guessed.
The problem is that your revelations are only going to be as good as the data you’ve collected. I’ve been a “serious music listener” for about 16 years, yet Last.fm has only been tracking my habits for three and my iTunes library only goes back six. I have ten years worth of listening that I will never have any way to quantify simply because the data was never collected.
Missing data, of course, skews results and in this case, snapshots of my habits are skewed in favor of recent years, especially when looking a cumulative lifetime stats. Using data from my library as it stands today, I put together a graph of my most popular years in music. I’ve been for the most part, a contemporary music listener, so the vast majority of my library contains music released from 1993-2008, adding new releases each year.
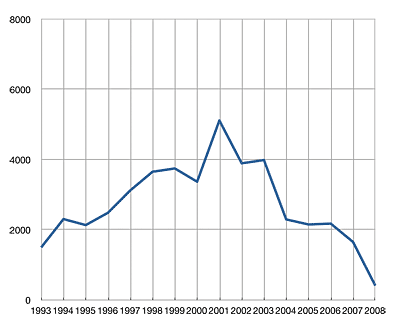
I calculated the total number of play counts received by all songs in my library that were released in a given year. Here’s the result:

This graph shows the distribution of all my play counts generated since July of 2002 (when iTunes began recording them). We see a peak in 2001 and a general downward slope since.
My explanation for the shape of the graph is that, as years come and go and a music library grows, newer music receives more attention than older music. Familiar tunes give way to new acquisitions and explorations. However, those old tunes never entirely go away; they continue to co-exist with the new ones. As the years pile up, each one’s presence is diluted among the rest and it becomes and increasingly uphill struggle to for the songs of a new year to reach parity with those of the past.
So in this particular graph, I attribute the 2001 peak to the simple coincidence that the songs from 2001-early 2003 were in high rotation at the time that iTunes started tracking play stats. As a result, the initial rate of change for those songs was quite high. And even though the rate at which those songs get played has decreased (exponentially) over time, the songs from other years still have to compete with them for attention, so we find a general trend decreasing cumulative play counts.

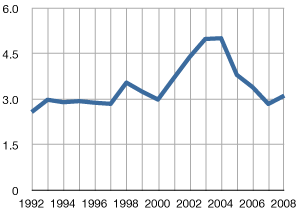
Average Play Count by Year
Further evidence of this idea can be seen in the average play count for the songs of each year. There’s a bump in the 2003-2004 area, reflecting the idea that older songs tend to accumulate more play counts over time.
I can’t help but wonder what that play count graph would look like if iTunes had been released in the early 1990s? How much cumulative lifetime play would we see throughout the years?
Of course, there’s no way to figure that out. That information is trapped in the fog of memory, stored in transitory listenings of cassette and compact disc. But while that individual play counts may be lost forever, it might not be impossible to make a decent educated cumulative guess.
I’ll start with the premise that from the years 1993-2001, I averaged a mere 10 songs per day between school bus rides, studying, hanging out, commuting and partying from early high school, through college and my entry into the workforce. That’s probably a conservative estimate, considering the general lengths of my bus rides and commutes. Heck, I’ve managed to generate nearly as many plays in the past 6 months, and I’ve lately been slacking on my music listening in favor of podcasts and audiobooks. But 10 is a good number, so I’ll stick with it.
So, at 10 songs per day, that’s 3650 plays per year. Consider the state of my collection in those early years. Throughout high school and into college, I managed to add records to my library at an average rate of one per week. If iTunes had been around at the time, play counts by now would be heavily concentrated in those early additions, with the highest concentrations being in the earliest records I bought.
By the end of the first year, my estimated 3650 plays would be spread among a mere 500ish songs, an average of 7.3 per songs. By the end of the next year, another 3650 plays would be spread out among about 1000 songs, 3.6 per song. Except that I expect that drop off in older songs to be exponential, not linear.
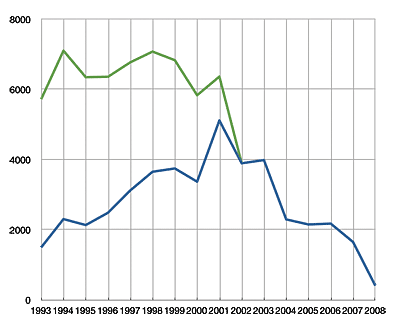
After some more conjecture and guess work, I extrapolated the accumulation of play counts over the years. After some number-crunching, I had a graph that looks like this:

The blue line is the same as above, showing the cumulative distribution of play counts by year of release in my iTunes library. The green line represents what the graph would look like if my estimated historical plays were added to the existing totals.
What does this totally unscientific, made up graph tell me? Basically what I already suspected: that I’d have to stop listening to my older tunes altogether and for a long time if I ever wanted current tunes to “catch up.” Of course, in the time it would take to do that, future tunes would be at a deficit. So really, while it’s a somewhat nice visualization, in reality it will have no bearing on my future plans.
How exactly did you get your itunes to graph that data?
Reply
tunequest Reply:
March 9th, 2009 at 10:01 pm
The graph was made manually. I took data from my iTunes library and made my calculations and graphics with Apple’s Numbers program.
Reply