MacBook Air 11.6″. Some real world usage notes

MacBook Air profile

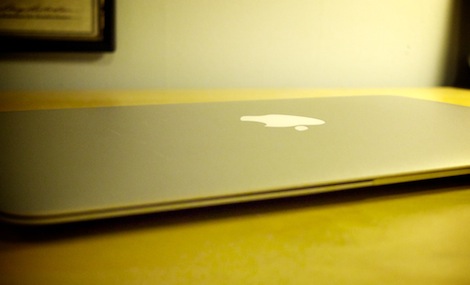
Hey folks. So I picked up one of Apple’s new MacBook Air notebooks. I had been wanting a more portable computer than my trusty tote-able 2008 MacBook Pro and the new 11.6″ form factor was mighty tempting. I did spring for the BTO 4GB RAM upgrade, but I opted to stick with the stock 64GB hard drive.

My first impressions are, like a lot of other reviewers, that despite its relatively slow clock speed the machine is fairly snappy and capable of doing more than just writing and web surfing. Yes, you can do real work on this thing. You just might have to have some patience during certain tasks.

After using it for about a day, installing programs, copying files (WIFI only) and running some usage tests I’ve come to two principle conclusions:

  • For CPU-intensive computational tasks, the 11.6 model is a bit of a laggard (blame the slow CPU)
  • But for usage involving many open applications and background tasks, the thing flies (thank the SSD)

Some Numbers

No usage summary would be complete without a few benchmarks, so I put together a suite of tasks to compare the performance with the other Macs in my house. The contenders:

  • 2010 MacBook Air 1.4Ghz Core 2 Duo, 4GB RAM, 64GB SSD
  • 2008 MacBook Pro 2.4Ghz Core 2 Duo, 4GB RAM, 200GB HD (5400 RPM)
  • (some tests only) 2006 iMac 1.83Ghz Core Duo, 2GB RAM

The tests included start up time, video encoding, misc usage tasks and working a Parallels 5 virtual machine to do some geospatial analysis.

The Tests

Start up time

  • Winner: MacBook Air, by a lot
  • It was more than thirty seconds difference so I stopped counting. I could probably start the Air up twice before the Pro even reached the login screen.
Parallels 5: Boot identical virtual machines:
  • MacBook Pro faster by ~3sec
Parallels 5: Launch ArcMap 9.3 GIS software inside VM:
  • MacBook Air faster by ~15 sec.
  • I did this one twice and the result was the same both times.
Parallels 5: Suspend VM:
  • Tie: virtually no difference
Parallels 5: Wake VM:
  • MacBook Air by 1 sec
Parallels 5: ArcMap: Spatial Autocorrelation analysis
  • Spatial Autocorrelation analysis is a computationally expensive process of searching for clusters of similar values inside geographic data. This task was run on a feature set of 3700 observations.
  • MacBook Pro by 59 sec
Parallels 5: ArcMap: High/Low Cluster analysis:
  • High/Low Cluster analysis is similar to Spatial Autocorrelation analysis. This task was run on the same feature set.
  • MacBook Pro by 60 sec
Parallels 5: Reboot of VM:
  • MacBook Pro by ~2 sec
Launching Safari with Parallels and Aperture open:
  • MacBook Air by ~25 sec
Wake VM with Safari and Aperture open
  • MacBook Air by ~10sec
Create a Par2 set from 110 MB of files:
  • MacBook Pro by ~10sec
Python script (time to task completion):
  • I’ve written a Python script that loads, parses and analyzes my iTunes XML file (~56 MB).
  • MacBook Pro: 40.5 sec
  • MacBook Air: 64.0 sec
  • iMac: 59.8 sec
Handbrake CLI video encoding
  • Convert a 1.7GB HD-Photo JPEG .MOV from my digital camera to a 900kbps mp4 using ffmpeg
  • MacBook Pro: 74 fps (fan kicked on)
  • MacBook Air: 47 fps (no fan)
  • iMac: 43 fps

Subjective Analysis

From the numbers we can clearly see that the faster processor in the 2-year-old MacBook Pro makes a big difference when crunching numbers. In all the CPU tests, the Pro performed the task in about 66% of the time as the Air. The real surprise (and disappointment) is where the Air barely keeps up with a 5-year-old iMac using an older chip architecture in the Python and Handbrake tests. (Though I suppose it shows that a 1.4 C2D can do the work of a 1.8 CD, which I’m sure helps with heat and power consumption).

One thing to note though, is that despite all the intense processor usage, the Air barely got warm. During the video encode test, while Handbrake was doing its best to max out both cores, the Macbook Pro’s fan kicked on to full speed after about 1 minute. The Air on the other hand stayed cool and quiet the entire time. This bottom comfort is something my lap and legs are sure to appreciate.

But what the Air lacks in raw power, it makes up for in responsiveness. It’s hardly possible to get it to hiccup, even when running tasks in the background. I was able to use Aperture to edit some RAW photos without any significant slowdown while copying 6 gigs of files to the Air. Kernel_task was chugging away at ~50% usage in Activity Monitor without any noticeable effect on the overall system performance.

And this is where productivity gains will be made with the Air. In all the tests above, the processes running were the only active applications and that’s rarely how I work. I often have multiple browser windows open and Mail and who know what other apps going simultaneously. Look at the Safari launch test. With both Aperture and Parallels open, the Air launched Safari almost instantaneously while on the Pro it bounced in the Dock for 25 seconds. Similarly, Parallels’ disk-based performance (waking the VM) slowed significantly when other programs were open competing for resources. If the Air can keep the dreaded beach ball from the showing itself, then I will be a happy, less frustrated Mac user.

Tunequest Year in Review 2008

This year’s end summary is going to be a little shorter than in the past, for two principle reasons: 1) 2008 was a lot busier for me than recent years, so my opportunities to explore and listen to new music were more limited, and B) I spent a lot of the free time I did have listening to audiobooks and podcasts rather than music. Indeed, 2008 saw only 510 new songs added to my library (with 103 of them largely unlistened because they were added in the last two weeks), compared with 2051 new additions in 2007.

And looking back over the numbers and trends, it is clear that my musical year for the most part ended toward the end of summer, since that’s when the new additions and activity begin tapering off.

Let’s not mistake quantity for quality though. 2008 was not without its highlights. Here’s a look back at the best music I discovered in the past year:

Kelley Polar: Love Songs of the Hanging Gardens (2005); I Need You To Hold On While the Sky is Falling (2008)

love songs of the hanging gardens

In December 2007, I heard my first Kelley Polar song. In January 2008, the album that song appeared on (Love Songs of the Hanging Gardens) rocked my world. I wrote on tunequest:

it pulls at you with pulsing with heady rhythms, ass-shaking grooves and a surprisingly high level of singability. The aspect that strikes me the most however, is how the music simultaneously seems to sound sparsely populated yet vast and teeming with activity. A bit like the seeming emptiness the heavens above, which when looked at closely is full of magnificent detail.

i need you to hold on while the sky is falling

Following shortly on my discovery of Love Songs, Polar’s second album, I Need You To Hold On While the Sky is Falling, was released on March. While I was less ecstatic about it than I was toward Love Songs–it’s darker tone and more intimate feeling weren’t quite as compelling–I still found the album quite enjoyable. It’s even grown on me a bit since the original review.

Together, the albums made a significant mark on my musical year.

Ratatat – LP3 (2008)

ratatat lp3

It should be of no surprise to long-time readers that Ratatat’s third LP made a big splash around here. Released in early July, LP3 rocked up my charts, becoming the most played artist, album and songs of the year.

With its simultaneous expansion of both guitar and keyboard sounds, the album pretty much ruled my summer.

The Breeders – Mountain Battles (2008)

mountain battles

After six years since their last album, The Breeders typified the idea of pent-up demand. The band has consistently ranked near the top of my favorites, which makes it frustrating that it spends long hiatuses between releases.

It’s made all the more frustrating by the album’s short length, approx. 36 minutes. But those 36 minutes are pure gold. As I said in my original review, the band’s “low-key, basement fuzz brings with it an inviting warmth.” The buzz and good feeling I got from this record’s release was capped off by finally, after 14 years, catching the Breeders in concert in June.

Stereolab – Chemical Chords (2008)

Stereolab is another perennial favorite around tunequest and a new album is sure to be listened to with much delight. Chemical Chords was no exception. The groop took a slightly different approach to this album, consciously creating shorter, simpler, more poppy songs than in the past. The result is a refreshing buoyant, dare I say happy, feeling from a band that has traditionally been cool and detached. Happy looks good on them, as I noticed when the band swung through town in September.

Junior Boys – So This Is Goodbye (2006)

Before picking up So This Is Goodbye, Junior Boys had long been on my radar. It was the opening band at a show I went to four years ago and they piqued my interest then. But it wasn’t until I happened across the record on eMusic that I finally checked the band out.

I was not disappointed. So This Is Goodbye is fantastic album. Expertly produced and crafted, the smooth electronic tones have an intimate, downtempo feel that borders on melancholic. It’s almost a rainy day album, except that it’s got too much shine behind it.

Grand Valley State University New Music Ensemble – Music for 18 Musicians (2007)

This album arrived late in the year, just before Thanksgiving, but it packed quite a wallop.

Steve Reich’s Music for 18 Musicians is a notoriously hard piece to perform. So it is something of a shock to see this, and pardon the bluntness, “no name” orchestra release what is probably to best rendition of it ever recorded. Written in 1974-1976 and focused largely on Reich’s fascination with harmonics, Music for 18 Musicians creates cyclical, trance-inducing soundscapes that mesmerize and fascinate the ears and mind. Grand Valley State’s recording is the first made in surround sound and it is a thing of sublime beauty that is quite an accomplishment.

::

There you have: tunequest highlights from 2008. There’s always great music out there and although 2009 is shaping up to be just as busy as last year, here’s hoping I have to to discover some of it.

Clair de Lune, visualized

Here’s a pretty neat visualization of Debussy’s best known work, Clair de Lune from the Suite Bergamasque. It was composed in 1903 and is quite famous.

Though I generally prefer string arrangements of this piece, this solo piano version is more faithful to the author’s original intent. Plus it’s easier to visualize and still sounds pretty cool. Enjoy.

This music and video was put together by Stephen Malinowski and his Music Animation Machine. You can find more performances on his YouTube page and more information on his website.

Cumulative lifetime play counts

A rambling, self-indulgent, inconsequential post about habits, statistics, speculations, accumulation and missing data.

::

I can’t help but be disappointed that I can’t see lifetime stats for my music listening habits. In these days of play count-tracking programs like iTunes and websites like Last.fm, it’s easy to get caught up in the musical trends of your life. It’s especially interesting when you look at the numbers and discover that you perhaps don’t like a certain style of music as much as you thought you did or you find that you listen to a particular band much more than you would have guessed.

The problem is that your revelations are only going to be as good as the data you’ve collected. I’ve been a “serious music listener” for about 16 years, yet Last.fm has only been tracking my habits for three and my iTunes library only goes back six. I have ten years worth of listening that I will never have any way to quantify simply because the data was never collected.

Missing data, of course, skews results and in this case, snapshots of my habits are skewed in favor of recent years, especially when looking a cumulative lifetime stats. Using data from my library as it stands today, I put together a graph of my most popular years in music. I’ve been for the most part, a contemporary music listener, so the vast majority of my library contains music released from 1993-2008, adding new releases each year.

I calculated the total number of play counts received by all songs in my library that were released in a given year. Here’s the result:

itunes play counts by year

This graph shows the distribution of all my play counts generated since July of 2002 (when iTunes began recording them). We see a peak in 2001 and a general downward slope since.

My explanation for the shape of the graph is that, as years come and go and a music library grows, newer music receives more attention than older music. Familiar tunes give way to new acquisitions and explorations. However, those old tunes never entirely go away; they continue to co-exist with the new ones. As the years pile up, each one’s presence is diluted among the rest and it becomes and increasingly uphill struggle to for the songs of a new year to reach parity with those of the past.

So in this particular graph, I attribute the 2001 peak to the simple coincidence that the songs from 2001-early 2003 were in high rotation at the time that iTunes started tracking play stats. As a result, the initial rate of change for those songs was quite high. And even though the rate at which those songs get played has decreased (exponentially) over time, the songs from other years still have to compete with them for attention, so we find a general trend decreasing cumulative play counts.

average play count by year
Average Play Count by Year

Further evidence of this idea can be seen in the average play count for the songs of each year. There’s a bump in the 2003-2004 area, reflecting the idea that older songs tend to accumulate more play counts over time.

I can’t help but wonder what that play count graph would look like if iTunes had been released in the early 1990s? How much cumulative lifetime play would we see throughout the years?

Of course, there’s no way to figure that out. That information is trapped in the fog of memory, stored in transitory listenings of cassette and compact disc. But while that individual play counts may be lost forever, it might not be impossible to make a decent educated cumulative guess.

I’ll start with the premise that from the years 1993-2001, I averaged a mere 10 songs per day between school bus rides, studying, hanging out, commuting and partying from early high school, through college and my entry into the workforce. That’s probably a conservative estimate, considering the general lengths of my bus rides and commutes. Heck, I’ve managed to generate nearly as many plays in the past 6 months, and I’ve lately been slacking on my music listening in favor of podcasts and audiobooks. But 10 is a good number, so I’ll stick with it.

So, at 10 songs per day, that’s 3650 plays per year. Consider the state of my collection in those early years. Throughout high school and into college, I managed to add records to my library at an average rate of one per week. If iTunes had been around at the time, play counts by now would be heavily concentrated in those early additions, with the highest concentrations being in the earliest records I bought.

By the end of the first year, my estimated 3650 plays would be spread among a mere 500ish songs, an average of 7.3 per songs. By the end of the next year, another 3650 plays would be spread out among about 1000 songs, 3.6 per song. Except that I expect that drop off in older songs to be exponential, not linear.

After some more conjecture and guess work, I extrapolated the accumulation of play counts over the years. After some number-crunching, I had a graph that looks like this:

cumulative play counts by year adjusted

The blue line is the same as above, showing the cumulative distribution of play counts by year of release in my iTunes library. The green line represents what the graph would look like if my estimated historical plays were added to the existing totals.

What does this totally unscientific, made up graph tell me? Basically what I already suspected: that I’d have to stop listening to my older tunes altogether and for a long time if I ever wanted current tunes to “catch up.” Of course, in the time it would take to do that, future tunes would be at a deficit. So really, while it’s a somewhat nice visualization, in reality it will have no bearing on my future plans.

Standard Deviation of the Years in my iTunes Library

I spent part of the past weekend doing some basic statistical analysis of my iTunes Library. I’ve been collecting music for 16ish years now, so I decided to see what kind of historical trends I could find.

One task I assigned myself was to look at the variety of the time span of the releases in my collection. Now I don’t have to do any fancy calculations to tell you that the vast majority of the songs in my library date to the same 16 year period that I’ve been collecting for. Indeed, if you line up all the songs in my library in chronological order by release date, the Median year is 1998. That is to say that half the music in my library was released before or during 1998 and the other half was released during or after that year.

The next step I took was to look at the variety of the release years for each calendar year that I’ve been collecting. I did that by segmenting my library by each year since 1993 using iTunes’ Date Added field, then calculating the standard deviation of the Year field for every song on that list. The lower the result, the more “consistent” that year’s additions were. The higher the number, the greater the eclecticism in that year’s acquisitions.

The results are plotted in this graph:

The green line is the standard deviation for my library as a whole.

In the 90s, I was pretty much an “alternative rock” junkie, so the span of years is pretty narrow overall. But see the bump from 2000-2002? That was late college and my hipster days, when I really had all the time in the world to haunt record shops, variety stores and Usenet groups in attempts to explore the most obscure nonsense. I mean, Morton Subotnik and film scores to Godzilla movies. That kind of nonsense.

It’s cool though, I also discovered Can and Neu! during that same time.

Tunequest is 2!

Happy birthday tunequest!

It slipped my mind until this very moment, and I meant to commemorate it at the time, but tunequest is two years old. On March 1, 2006 I launched a small website to log my musical adventures as I listened to every last song in my ~15,000 song (at the time) iTunes Library. It was a modest post that simply stated what I had listened to that day.

I set a goal for the end of the year, which I met on New Years Eve, averaging more than 50 songs and 3 hours of music listening per day. The site’s slogan at the time as “No Repeats,” as I couldn’t spend the time to listen to any song more than once.

But the exploration of music didn’t end with the final play count. This decade has been an exciting time for music and technology, as they have been greatly influenced by each other. Thanks to the Internet, each day has more music instantaneously available than at any point in history. And after the tunequest ended, the site kept humming along, continuing to post thoughts and insights on music and technology.

Numbers wise, I consider tunequest@2 a modest success. The feed counter broke 100 for the first time today, so a friendly “hello and thanks” to all you feedfolk. The site also receives more than 3,000 unique visitors per week and manages to pay for itself, which I’m happy about. All-in-all not bad for a guy’s hobby.

If you’re a feed reader and haven’t been to the site lately, then you’ve been missing the tunequest reading list, frequently-updated, hand-selected articles, blog posts and links to interesting and noteworthy stories in my sidebar. Stop on by and check it.

Here’s to keepin’ on keepin’ on.

High Impact Albums of 2007

In my last post, I detailed the ten albums that earned the highest ratings from me during 2007. But while I did find them each to be fantastic recordings, ratings don’t necessarily reflect popularity. That is to say that the most highly rated albums might not have been the most often played.

Indeed that’s not the case. I took data from the past year and ran it through my Impact report, which measures the relationship between total play counts and the number of songs an album or artist has in my library in order to see who has received the most attention relative to their size

While the results show some significant overlap with the top rated list (of course I listen to what I like), it turns out that being highly rated doesn’t necessarily guarantee a lot of playing. So without further ado, here are the albums that made the biggest splash last year.

1 Nine Inch Nails – Year Zero

Impact Rating: 1072

Showing Trent Reznor at his best, Year Zero received significant airplay throughout the year, enough to earn it the title of “Tunequest’s Most Impactful Album of 2007.”

2 Air – Pocket Symphony

Impact Rating: 1064

I listened to Pocket Symphony in a huge burst after its March release and kinda petered out over the remainder of the year. Still, that initial burst was enough to coast to a second place ranking.

3 Rilo Kiley – Under the Blacklight

Impact Rating: 1021

Rilo Kiley is one of a handful of musical acts that both the modernista and I actively like. It should be no surprise then that despite its late summer release, Under the Blacklight was in heavy rotation for the duration of autumn, so much so that it claimed the number three spot.

4 The Polish Ambassador – Diplomatic Immunity

Impact Rating: 936

The Ambassador’s debut disc broke into my brain early last year and left a substantial wake in its path. Our intergalactic diplomat’s electrogrooves are really really catchy. In my library for nearly the entire year, Diplomatic Immunity garnered the most play counts of any album I acquired in 2007.

5 Radiohead – In Rainbows

Impact Rating: 355

Radiohead’s revolutionary distribution may have brought the record to my ears, but its quality kept it playing again and again. Though In Rainbows narrowly missed my Top Rated Albums of 2007, it was listened to enough to become the fifth highest impactful album of the year, quite a feat considering the early October release of disc one and the early December release of disc two.

Also of note, here we see a huge drop in impact ratings between places 4 and 5. It’s clear that the top four were the breakaway albums of the year. Those four albums were responsible for 20% of the impact points generated among new aquisitions last year. Which means that either those albums are fantastically good (and they are) or I need to diversify my habits a bit (which I probably do). But hey the ears like what they like.

Moving on:

6 David Arnold: Casino Royale

james bond casino royale 2006

Impact Rating: 338

I’ve been checking in on David Arnold’s film works every so often since the late 90s, when I discovered his score for the original Stargate film. Since then his scores have continued to impress me, especially his work for the James Bond franchise. His composition for Casino Royale, the 2006 re-booting of the Bond character, is perhaps his finest contribution yet. Lush, inviting and full of suspense and action, Casino Royale projects the best of the Bond musical heritage with a suave confidence that’s the hallmark of the character. But it adds its own unique motifs and ambience, keeping it from sounding like a re-hash of John Barry’s seminal soundtracks.

A highlight of the record is I’m The Money, a short 27-second track. But those 27 seconds are filled with the distlled essense of the entire score and they evoke the predominate atmosphere of the film as well, from the exotic and intriguing to the dark and dangerous.

I’m The Money:
[audio:080121ImTheMoney.mp3]

The more I listen to this one, the more I might think it’s the best score of Arnold’s carreer and perhaps the best in the entire James Bond series.

Rounding out the Top Ten Impactful albums of 2007

All the remaining records also appear on my Top Rated 07 list.

7 Susumu Yokota – Symbol Impact Rating: 335
8 Pink Floyd – Dark Side of the Moon Impact Rating: 324
9 The Polish Ambassador – The Phantasmal Farm Impact Rating: 301 (A good year for the Ambassador around here)
10 The Smashing Pumpkins – Zeitgeist Impact Rating: 261

For those would would like a baseline, the average impact for all records acquired in 2007 was 68, while the median was 16. Additional math shows me that the top 20 records were responsible for just more than half the impact ratings generated throughout the year. So I’ve resolved this year to show some more consideration with my musical choices. Last year’s massive influx of new tunes was largely a response to having neglected many new records and trends in music while partaking in the original tunequest. This year I’ve decided to purposefully not seek out too many new records and spend more time with the ones I do get.

So, here’s to tunequest 2008, whatever form it may take.