I spent part of the past weekend doing some basic statistical analysis of my iTunes Library. I’ve been collecting music for 16ish years now, so I decided to see what kind of historical trends I could find.
One task I assigned myself was to look at the variety of the time span of the releases in my collection. Now I don’t have to do any fancy calculations to tell you that the vast majority of the songs in my library date to the same 16 year period that I’ve been collecting for. Indeed, if you line up all the songs in my library in chronological order by release date, the Median year is 1998. That is to say that half the music in my library was released before or during 1998 and the other half was released during or after that year.
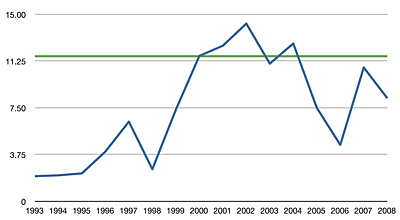
The next step I took was to look at the variety of the release years for each calendar year that I’ve been collecting. I did that by segmenting my library by each year since 1993 using iTunes’ Date Added field, then calculating the standard deviation of the Year field for every song on that list. The lower the result, the more “consistent” that year’s additions were. The higher the number, the greater the eclecticism in that year’s acquisitions.
The results are plotted in this graph:

The green line is the standard deviation for my library as a whole.
In the 90s, I was pretty much an “alternative rock” junkie, so the span of years is pretty narrow overall. But see the bump from 2000-2002? That was late college and my hipster days, when I really had all the time in the world to haunt record shops, variety stores and Usenet groups in attempts to explore the most obscure nonsense. I mean, Morton Subotnik and film scores to Godzilla movies. That kind of nonsense.
It’s cool though, I also discovered Can and Neu! during that same time.